X

Hydrogen technology and thermal analysis

Green energy – hydrogen circle – hydrogen economy

A main key to green energy and green mobility is the use of hydrogen as fuel, for energy storage and tool for energy transfer processes. Therefore, the so-called hydrogen circle was established that shows the use of hydrogen from the generation over storage and export to the use as fuel back to the generation. This is critical for understanding hydrogen conductivity and its applications.

As there are many ways for each step in this cycle, some research concepts were established to close gaps and get access to techniques that are necessary and not yet fully developed. The Fraunhofer research society developed and published a hydrogen road map for Germany, where all research areas and topics are shown.

The following scheme shows the key sectors:

Hydrogen roadmap Germany

Hydrogen roadmap for Germany (source: Fraunhofer Institute)

Hydrogen circle

the Hydrogen circle

The road map shows the possible hydrogen use in the near future. The key issue is always the storage and production, as every sector is affected by the question how to store hydrogen safely and efficiently. Another question to answer is, if central or decentral hydrogen production is more promising and if it shall be used as a fuel directly or in form of ammonia or similar substances.

1. Hydrogen cycle – Renewable energy sources

The hydrogen cycle starts with the hydrogen generation by green power plants. The most important sources for renewable energy harvesting involve hydropower plants, wind mills, photovoltaic parcs, geothermal plants and biomass plants with the goal to generate energy in sufficient amount without any CO2-emissions and without nuclear waste generation.

Thermal analysis and Material Science are present in all of them:

  • from the research on composite materials, how they are used on wind mill blades
  • to material optimization of semiconducting materials in photovoltaic cells
  • to optimization of direct Hydrogen production from Biomass applications.

wind mill

Application example: Thermal expansion behavior of light-construction-materials

info iconA good example where thermal analysis comes into play at renewable energy is the thermal expansion behavior of light-construction-materials like composites for wind mill blades:

Composite materials are used in light constructions or as special construction materials for many purposes.
For instance, the blades of windmills are made of light aluminum alloys or light polymers.

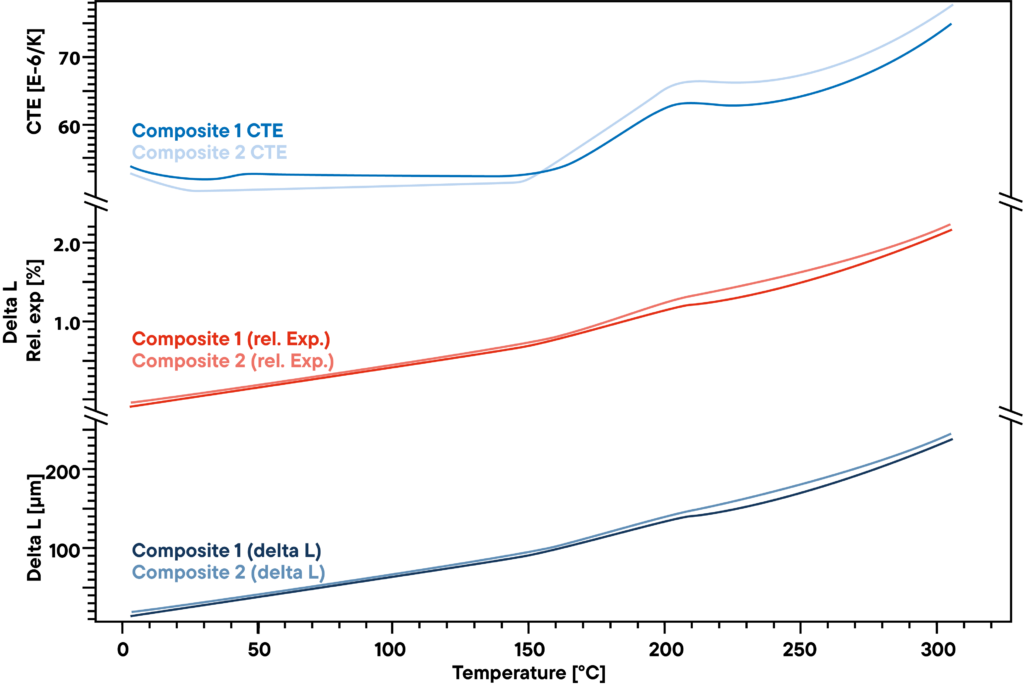
The measurement shows the slight difference in two polymer composites that are used for stiff but light constructions like windmill blades. The absolute delta L that was measured by a Linseis pushrod dilatometer by constant heating with linear rate of 5 K/min (lower curve). It does not show a significant difference between the two samples that were analyzed. Also, the relative expansion (red curves) is very similar.

However, there is a slight difference that becomes visible when the CTE is observed. Before the transformation point at around 200°C, there is a little effect that can be seen only at one of the two samples, indicating another small transformation or phase change that the other material does not show.

Application example: DEA – dielectric analysis / cure monitoring

For a cost efficient and high-quality production of composite materials, it is of highest importance to know both, the exact time and temperature profile required, to make sure the specific part is finished.

info iconIf these parameters are chosen wrong, either the quality of cannot be achieved or money has been wasted. This process of curing can be monitored due to too long waiting times using DEA – Dielectric Analysis.

Application DEA – dielectric analysis cure monitoring

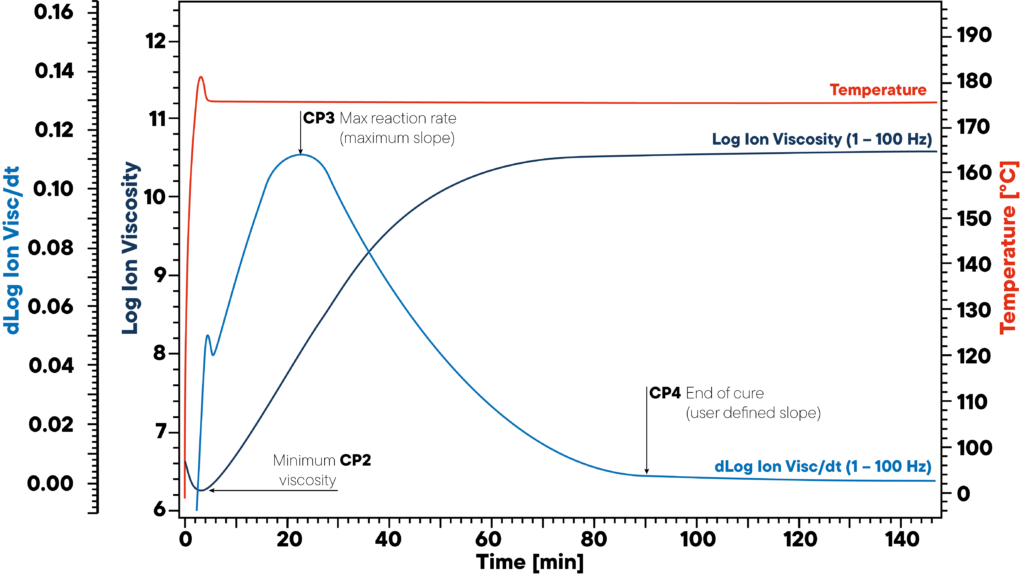
The curing of most polymers can be observed by DEA sensors that are put into the uncured material.

In the example, resin is heated to 180 °C isothermal and a DEA sensor is applied. The red curve shows the isothermal temperature of the sample and sensor. The ion viscosity and slope of ion viscosity are monitored.

The three significant points CP2, CP3 and CP4 mark the beginning (minimum viscosity), the maximum reaction rate (maximum slope) and end of curing. This information is crucial for proper polymer curing as uncured materials can lead to severe quality issues.

Application example: quality and behavior of the raw materials e.g. biomass

Another important point for the production of hydrogen is the quality and behavior of the raw materials, e.g. the used biomass for power and hydrogen generation.

info iconThe question is how much hydrogen can be obtained by various raw materials during gasification, how much energy is requested and what is the total outcome. This can be monitored by pressurized thermogravimetry and combined thermogravimetry and calorimetry (STA), like shown in the following application example.

Biomass gasification
Application Biomass gasification

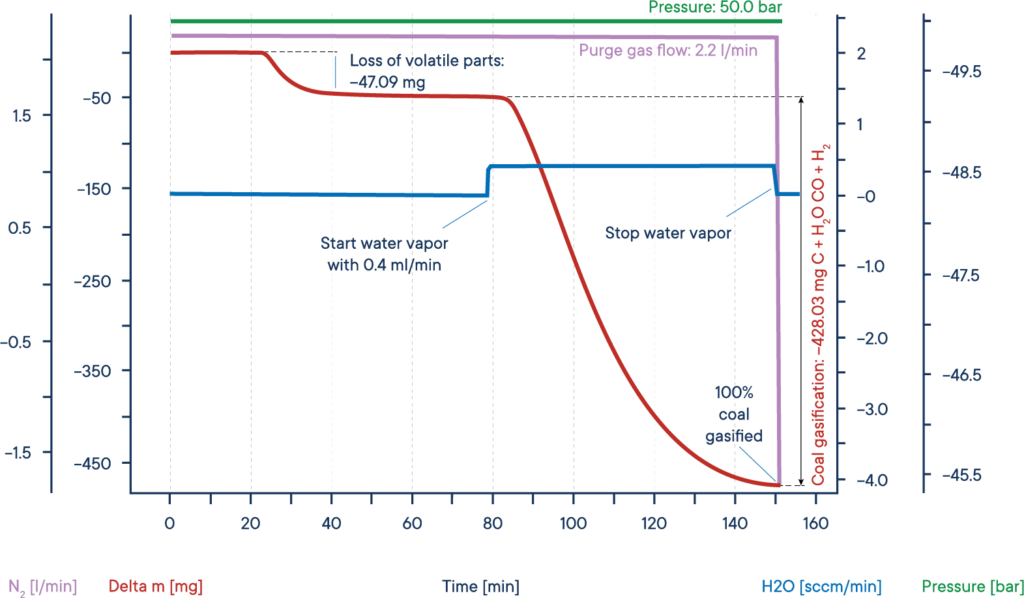
A typical application for high pressure TGA measurements is the investigation of the so-called coal gasification or hydro-gasification. This process, where carbon is heated in a water steam atmosphere, is used in catalytical processes, for example to remove carbon monoxide from exhaust fumes and specially to get valuable organic compounds out from resources like charcoal or biomass.

The given example shows a typical gasification experiment of dry biomass. The biomass sample was heated to an isothermal plateau under nitrogen atmosphere at 50 bar pressure (High Pressure TGA – Thermo balance).

The mass signal shows the loss of volatile components between 20 and 40 min. After water vapor was added, the biomass was gasified and nearly completely consumed after 150 min, leading to H2, CO, CH3OH and other useful reactive gases, as shown by the red mass loss curve.

The whole process can be described like this: Carbon reacts with water vapor to a mixture of carbon monoxide and hydrogen. The obtained carbon monoxide can react with a second water molecule to carbon dioxide and additional hydrogen and finally the resulting hydrogen can form methane and other hydrocarbons out of carbon monoxide.

Application example: investigation of burning behavior and ash content of composites

info iconLast but not least, after the product life cycle time ends, the composite materials need to be recycled or energetically used. For this, it can be of interest to investigate the burning behavior and ash content.

Ash content of rubber

Carbon containing materials, organics and polymers usually burn off when heated. The investigation of thermal decomposition of such materials is therefore a bit special. In most cases it is carried out in inert atmospheres instead of air to be able to see decomposition effects and pyrolysis, followed by a gas switch to oxygen or air, leading to a burn off of the contained carbon.

If this procedure is carried out on a combined thermal analyzer (STA), the carbon content, inorganic content and released heat can be measured.

This measurement of an industrial rubber sample was carried out with a simultaneous thermal analyzer STA PT 1600, starting at nitrogen atmosphere.

The sample was heated in three steps with each 30 K/min. The blue curve shows the relative weight loss. In a first weight loss step, the dehydration of the sample takes place. The amount of water was 9.3 %. The corresponding DTA signal (purple curve) did not show any effect during the evaporation of water.

In the second reaction step, the volatile components are released by pyrolysis under N2 atmosphere. The amount of these components is 36.0%. Their release can be identified by an exothermic reaction peak on the DTA curve.

For the third reaction step, the atmosphere is changed to O2, leading to a burn off of the remaining carbon. The loss in weight is 14.3 %. The remaining 40.4 % are inorganic components like ashes, slake or fillers.

2. Transformation from electrical to chemical energy (Electrolysis, Synthetic Fuels)

As it is rather difficult to store electrical energy, todays big power plants, like coal plants and nuclear plants, produce a continuous amount of energy in order to cover the base load and more variable ones, like gas plants are used to compensate fluctuations.

As the electricity production form renewable energy is subject to fluctuations (e.g. during night, dryness or when wind calms down), the produced energy needs to be stored, to address the need of a continuous and fluctuating demand of energy with the discontinuous generation of the renewable energy sources.

In addition, some applications like mobility (high range cars, trucks, planes), require big quantities of energy, the storage of the electrical energy in accumulators is not practical, as accumulators in the required size are expensive and not ready for operation. For these applications it is more convenient to transform the electrical energy to chemical energy in form of synthetic fuels or hydrogen. As synthetic fuel is also a produced using hydrogen, the main step is to produce hydrogen from Water by electrolysis.

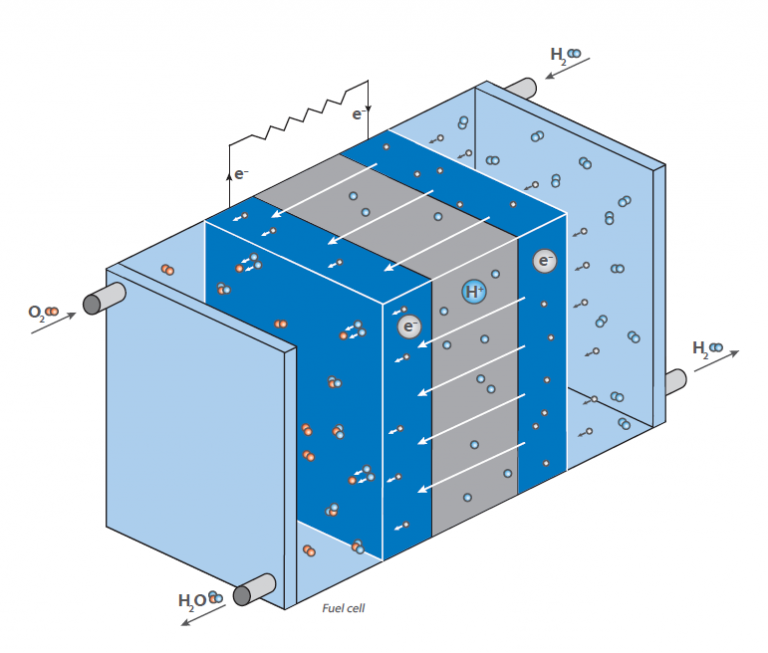
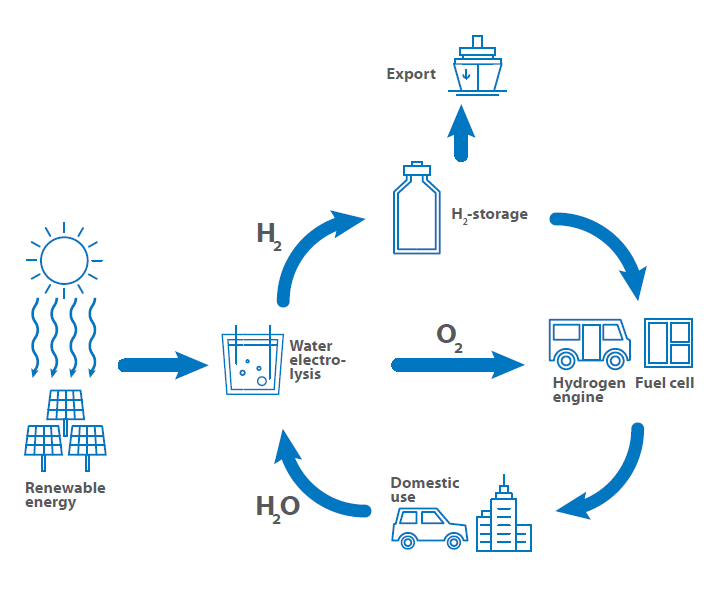
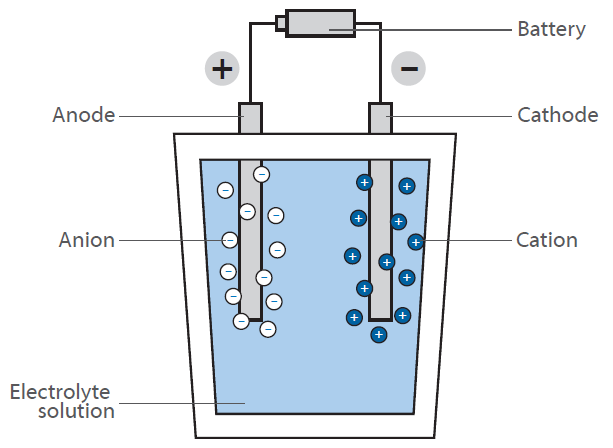
Electrolysis of water is the chemical separation of water into oxygen and hydrogen gas by applying an external voltage. As this process of hydrogen generation requires a lot of energy, there are also methods used that generate hydrogen by catalysts or reaction chains such as coal gasification.

However, the goal is to get access to a direct electrolysis with a high throughput and efficiency. In order to improve the efficiency of the electrolysis, the cathode and anode materials as well as catalysts and surface materials need to be optimized.

Electrolysis scheme

Application example: Catalysts – Thermal expansion of platinum wires

info iconThermal analysis can help here by characterizing the used materials regarding chemical stability, thermal conductivity and sorption capability but also by determination of thermal expansion to improve life times and quality.

Application thermal expansion of platinum wires


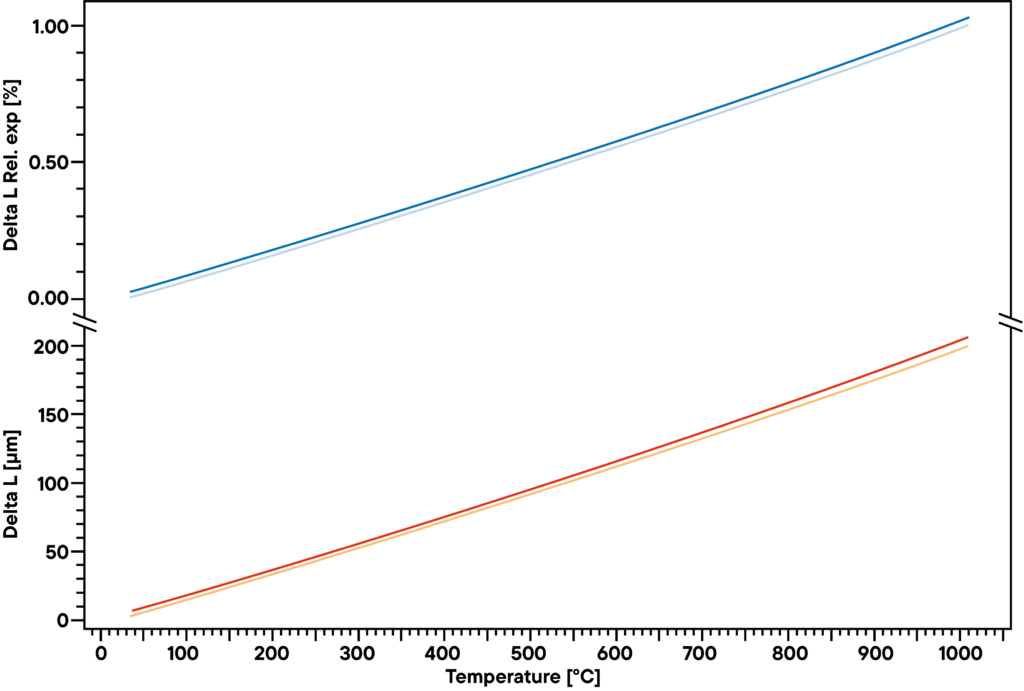
Platinum is used as a catalyst, as pure material or in many alloys. As the use as an alloy is the more common use due to several advantages an alloy has, the physical and chemical behavior changes slightly. The example  shows the difference in thermal expansion between platinum and platinum with 3% Rhodium.

In the example, platinum and a platinum alloy were measured using a Linseis pushrod dilatometer with linear heating rate of 5 K/min. The two lower curves show the absolute thermal expansion, the upper curves show the relative expansion of a platinum sample compared with a platinum-rhodium alloy.

Even there is only a tiny difference in chemical composition, the expansion behavior shows a deviation of some μm in the range up to 1000°C. If used in a complex structure like a reactor, the exact expansion values have to be taken into account to avoid damage to the electrolysis unit due to different expansion coefficients.

Application example: Thermal Management – Thermal conductivity of graphite

Besides the thermal expansion that can cause problems in a complex structure, also the thermo-physical properties like thermal conductivity and resistivity are very important.

The key is proper heat management. If there is no big temperature difference within the reactor, there is also no problem with thermal expansion. For that reason, it is good to know also the thermal transport properties of all used materials.

info icon

To sum it up: Optimization of the thermal properties of hydrogen helps to save cost and improve Quality. Nanostructured Catalysts for example have a bigger active surface and require less raw material.

Application thermal conductivity of graphite

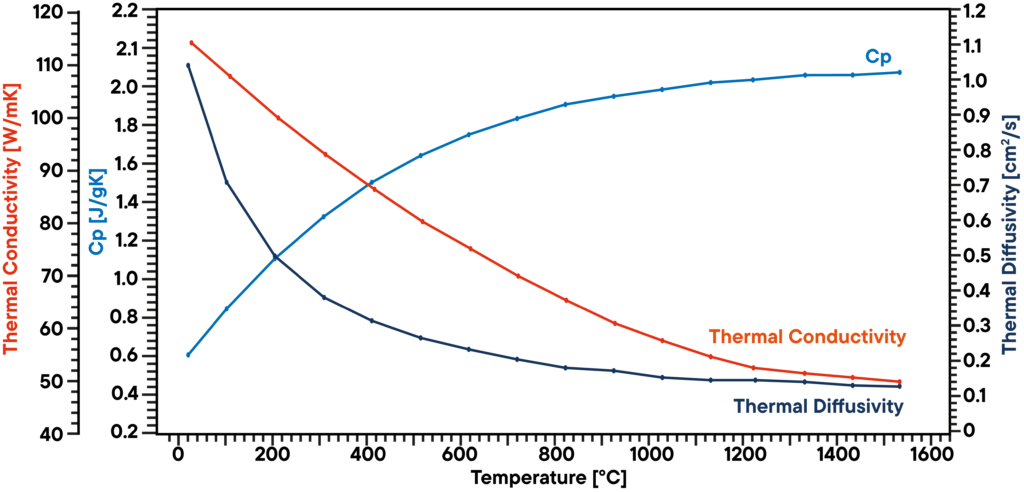
Graphite is a carbon species that occurs as a dark grey solid. It has a considerable high chemical resistance and is used in many ways, for example as cathode material, construction material, sensor component and many more. If heated, it reacts with oxygen to carbon monoxide or carbon dioxide, however it can reach very high temperatures if it is heated in inert, oxygen free environment and for this reason it is used in ultra-high temperature furnaces as furnace material or even heater.

In this example, a graphite sample has been analyzed in vacuum using a LFA 1000 (Laserflash Analyzer). Thermal diffusivity has been measured directly at several temperature steps between RT and 1100°C. Specific heat capacity has been determined using a known graphite standard in a second sample position as a reference in the same measurement.

The product of diffusivity, specific heat and density gives the corresponding thermal conductivity. The result shows a linear decreasing thermal conductivity which is typical and a thermal diffusivity that is showing a plateau above 500°C. The Cp is slightly increasing over temperature.

Application example: Synthetic Fuel – Pressure dependent reactions by STA High Pressure

info iconFor some applications, like aircrafts, it can be advantageous to bind the electrical energy in a more stable form than hydrogen, which are synthetic fuels.

Synthetic fuels have the big advantage, that existing infrastructures and designs could be used as they are. The idea is to use the green hydrogen and form synthetic hydrocarbons with it. During the forming process, CO2 from the atmosphere gets bonded, but during the usage (burn) of the synthetic fuel, the CO2 gets released again.

The formation process of synthetic fuels (Fischer-Tropsch-Process) can be optimized using high pressure TG and TG/DSC systems like the LINSEIS High Pressure -STA.

Application Pressure dependent reactions by HP STA

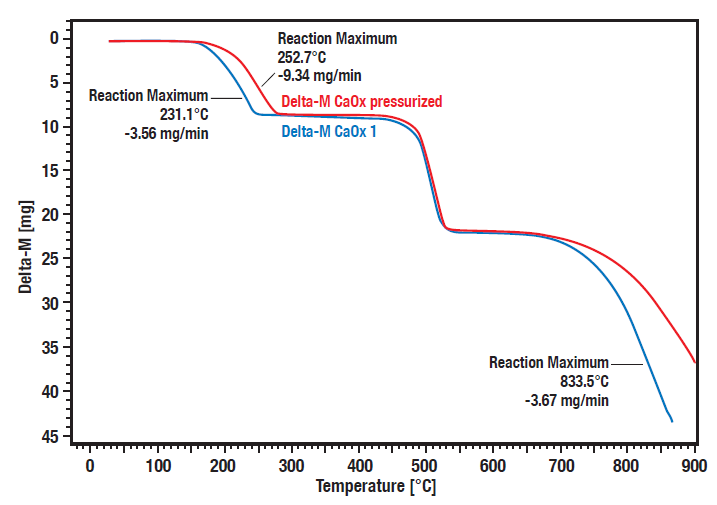
The Linseis STA HP series allows measurements under controlled elevated pressure. For some reactions like decompositions, adsorption and desorption, the behavior of samples and materials is very much depending on the atmospheric conditions as there is a pressure dependency of many reactions.

These curves show the comparative measurement of calcium oxalate hydrate decomposition under pressure (20 bar, red curve) vs. atmospheric condition (blue curve). A significant pressure dependence of the decomposition steps 1 (loss of water) and 3 (loss of carbon dioxide) can be observed.

The decomposition steps 1 and 3 are shifted to higher temperatures at elevated pressure. The second step is the irreversible transformation from organic oxalate to inorganic carbonate, releasing carbon monoxide. As this is not reversible it is not pressure depending.

3. Hydrogen storage

As Hydrogen is a very volatile gas, it’s storage and transportation is rather challenging. It can be stored by compression of the H2 gas in cylinders, but due to the high pressure needed (cylinders exist with a maximum pressure of up to 700 bar) and the related technological and safety related problems (hydrogen diffuses through any material by time) other technologies are preferred.

For example, hydrogen can be stored by sorption on different kind of materials where it is more or less chemically fixed (metal organic frameworks (MOF), zeolites, ionic liquids etc.). However, the storage as metal hydride is the most promising.

In this case the Hydrogen is chemically bound to a metal surface by forming the stable hydride. This process can be optimized by enlarging the surface area due to the use of porous materials such as zeolites and synthetic frameworks with nanopores. In many materials, the hydrogen can then be released by controlled temperature changes or pressure changes that are easily to apply. The risk of uncontrolled diffusion is no longer given.

Hydrogen storage

Application example: High pressure STA sorption

info iconThermal analysis, especially gravimetric analysis can help to identify the exact sorption conditions, release and storage rates to optimize the load- and release-cycles.

Application HP STA sorption

The measurement of sorption performed with volumetric methods normally gives no information about heat flow and enthalpy. If the heat of sorption is of interest, a second experiment is needed.

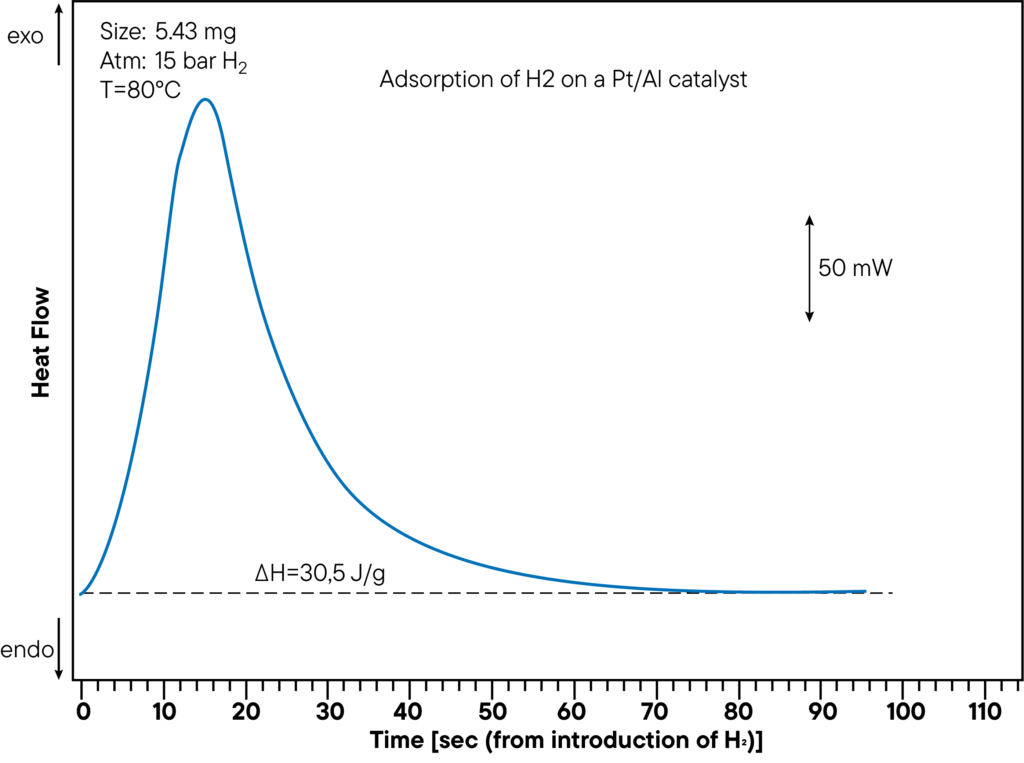
The Gravimetric Sorption Analyzer (High Pressure TG-DSC), which measures both weight change (TGA Thermogravimetry) and (DSC) Differential Scanning Calorimetry- signal, provides a much faster alternative.

Within one experiment, the sorption capacity as well as heat of sorption can be measured. The figure shows the DSC- measurement -part of the adsorption of Hydrogen on a Pt/Al catalyst at a pressure of 15 bar and a temperature of 80°C. The evolved heat is 30,5 J/g. The heat of sorption was directly determined during the sorption experiment and shows a clear peak. In the curve above, the time from hydrogen introduction to sorption reaction was monitored to show how fast the sample interacts with the atmosphere.

4. Devices and processes using hydrogen as fuel

Once the hydrogen is created and stored and available for the (mobile) use, its high energy density allows the various applications.

The most common ones are the use as reducing agent, fuel, carrier gas and for synthesis of molecules like carbohydrates, ammonia or many more. A frequently used application is the sintering of metals.

Metallic or metal-oxide containing workpieces are often manufactured by compressing powders to so-called green bodies. These green bodies are later consolidated by heating them at a temperature below the melting point, a process called sintering. During sintering a reduction of dimensions is observed. In consequence, the sintering process can be studied by measuring the dimension. This is usually done in a dilatometer (see application example).

In order to avoid oxidation and also to reduce the content of oxides of the final product, sintering can be done in a hydrogencontaining atmosphere or even in pure hydrogen atmosphere.

Due to its knowledge in hydrogen safety technology, LINSEIS is able to provide dilatometers for use in pure hydrogen atmosphere. The dilatometer can be used for hydrogen sintering or expansion measurements in reducing atmospheres. The outgassing is coupled to a burn of safety unit and the system is connected to a hydrogen detector that can shut down the system and flush it with inert gas in case of an uncontrolled hydrogen release.

Application example: H2 sintering of metal powders

info iconThe example shows hydrogen sintering of metal powder green bodies that are used as catalysts.

Application H2 sintering of metal powders

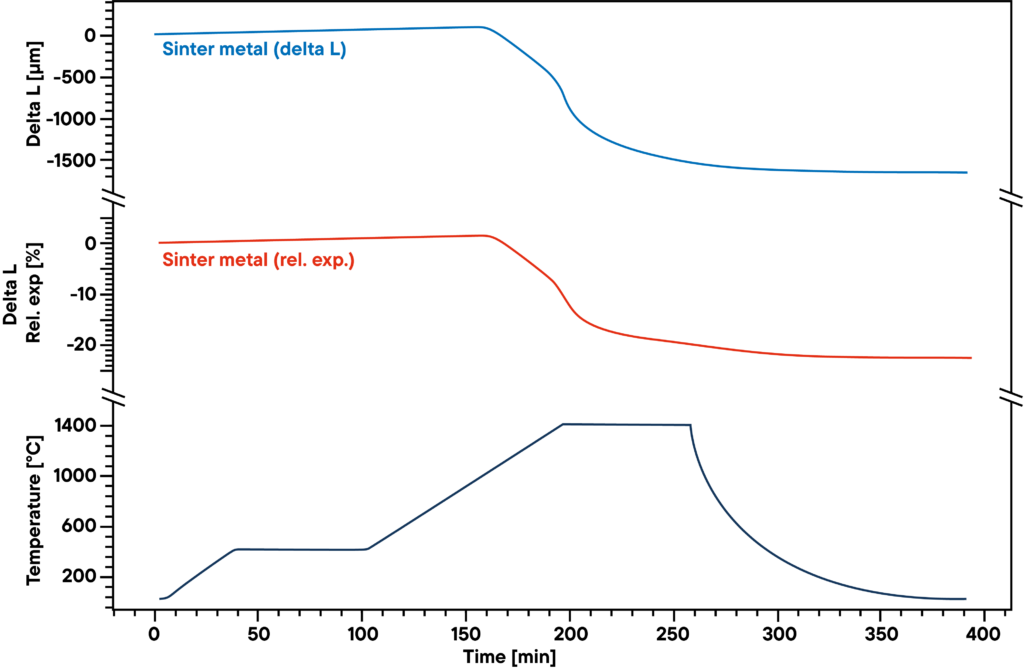
The measurement shows the sintering curve of pressed sinter metal powder that was heated according to the sinter profile (lower curve) in absolute hydrogen atmosphere.

The hydrogen reduces the oxygen contained in the sample during the sinter process and causes a higher density and lower metal oxide percentage. Therefore, the gas atmosphere as well as sinter profile have significant influence on the results.

The blue curve shows the relative expansion and shrinkage, the red curve shows the absolute values. The main sinter step can be observed in the second heating phase between 500°C and 1400°C.

5. Fuel cell technology

Nevertheless, the most interesting and most commonly mentioned applications for hydrogen are fuel cells, which can be used in many different situations, from supplying buildings with electricity and heat to powering cars with increased range. They are the key part in transforming the stored energy back from hydrogen to electricity.

In a fuel cell, hydrogen reacts with air to form water. This reaction is not used directly by burning, yielding heat, but in a fuel cell generating electrical energy: The scheme shows a schematic view of a hydrogen fuel cell.

The purpose is to generate electrical energy “on demand” by the reaction of hydrogen and oxygen. In contrast to the classical, direct reaction, where water is formed under a huge release of energy in form of heat (imagine a hydrogen-oxygen gas mixture that is ignited), a fuel cell has two chambers, containing the two compounds.

In the middle of these chambers, there is a membrane, that allows diffusion of hydrogen but not of any other molecule. At the surface of the membrane on the oxygen chamber site, the reaction of hydrogen and oxygen takes place, resulting in water that is brought out of the cell. This leads to a decrease of hydrogen concentration at the membrane and causes more hydrogen molecules to move towards the membrane. By the diffusion of hydrogen to the oxygen containing chamber, there is some electrical voltage generated at the membrane. This is the energy that is now released instead of heat and can be used for operating an engine.

Fuel cell technology

As the hydrogen concentration at the hydrogen chamber can be controlled, the diffusion rate at the membrane can be easily controlled like in a gasoline driven engine. The hydrogen can therefore be considered as “fuel”. The membrane is covered with an electrode material consisting of noble metals. These metals serve as catalyst and act on the fuel cells working conditions (temperature, voltage etc.).

As hydrogen driven fuel cells can work at high temperatures up to 1000°C and the solder used for their assembling has to be thermally, chemically and mechanically stable, here again thermal analysis comes into the game. Working conditions of the fuel cells depend on used materials which can act as catalysts.

So, all techniques used for the characterization of catalysts find an application in hydrogen technology. In consequence, much knowledge in material science is needed and many analysis techniques will help to investigate the materials. In this case, we will focus on thermal analysis techniques.

Some hydrogen storage applications run at high pressure sometimes exceeding 100 bar so that pressurized analyzers are useful. Additionally, all analysis techniques need precautions due to the high reactivity of hydrogen to oxygen/air. In consequence all devices have to be equipped with safety feature avoiding the risk of explosions.

PEMFC* AFC** DMFC* PAFC* MCFC*** DOFC***
Operating temperature 40 – 90°C 40 – 200°C 60 – 130°C 200°C 650°C 40 – 90°C
Fuel H2 (/CO2) H2 Methanol H2 (/CO2) CH4, H2, CO CH4, H2, CO
Electrolyte Polymer KOH Polymer Phosphoric acid Molten carbonate Solid oxide

*Noble metals **Noble metals/Non-noble metals ***Non-noble metals

Application example: Hydrogen release from surface storage

The following application example shows where thermal analysis and material science equipment is used in the field of hydrogen energy and fuel cell technology:

info iconHydrogen storage can be performed as surface adsorption, pore adsorption or chemical uptake. For most metals, the surface sorption is the most promising way because it is easy to achieve and the hydrogen release can be controlled very well. Therefore a lot of metals with high specific surface are investigated.

Application Hydrogen release from surface storage

Titanium hydride is a common used hydrogen resource for controlled release of hydrogen in various reactions. On the one hand it can be used as a catalyst in liquid chemistry in situ as a hydrogen source, on the other hand it can be used for example in batteries or fuel cells for controlled hydrogen release.

To get an idea what amount of hydrogen is released at what temperature, it is important to know the temperature dependent decomposition behavior and released amount of heat, which can be monitored by simultaneous thermal analysis (STA).

In this STA measurement, the release of hydrogen by titanium hydride was monitored. TG and DSC signal were measured from room temperature to 800°C while the sample was heated linear in Argon atmosphere with 10 K/min. Between 300°C and 600°C, there is a two-step mass loss of 2.3% in total which means the complete amount of bound hydrogen is released in that process. The DSC curve shows the corresponding Desorption peaks (red curve).

Safety equipment for Hydrogen measurements

Hydrogen has a high affinity to oxidants and metal surfaces as well as oxygen. The formation of water out of the elements (2 • H2 + O 2 = 2 • H2O; ΔH = 286 kJ/mol) is an exothermic reaction that is the reason why hydrogen is considered as a powerful energy storage media.

Hydrogen-air mixtures are sensitive to explosion for hydrogen contents bigger than approx. 4%. The activation energy (without catalyst) is high but in presence of a flame, a spark or high temperature such mixtures can burn or explode. So, whenever doing thermal analysis including hydrogen concentrations bigger than 4% in air some safety precautions are mandatory.

All LINSEIS thermal analyzers for hydrogen applications can be equipped with the following safety features:

Hydrogen safety equipment

Hydrogen detectors
Hydrogen detectors will detect eventual leakages in the gas lines. These detectors are positioned close to the hydrogen instruments, detecting any leakage or accidental release.

Safety valves
As soon as a hydrogen leakage is detected, safety valves will act and cut off the hydrogen supply to the thermal analyzer.

Flushing with inert gas
When a leakage is detected and the hydrogen supply is stopped, the remnant hydrogen in the analyzer will be purged out by inert gas.

Burn off unit for outgassings
At the outgas connector, all Linseis Hydrogen systems are equipped with a burn off unit. The outgassings (sample gas, purge gas and decompositions products) pass the constant burning flame to ensure that no flammable gases are released to the environment and could reach critical concentration in the lab. The flame unit is electrically heated and has a security mechanism to avoid any kickback of the flame into the gas lines.

Linseis is the worldwide leader in instrumentation for use with hydrogen. Our product line includes:

To learn more about our offerings, get in touch with us today.