

In cooperation between Linseis Messgeräte GmbH and RECENDT GmbH (Research Center for Non-Destructive Testing GmbH), a real-time grain size determination system based on a dilatometer system (DIL L78/RITA) (DIL L78) and an adapted laser ultrasound sonic (LUS) was developed.
The grain size is determined from the LUS data as follows:
The non-destructive NDT technology “laser ultrasonic” (LUS) enables an in-situ analysis of the grain size based on an evaluation of the frequency-dependent ultrasound attenuation 𝛼(𝑓), which is mainly caused by the scattering at the grain boundaries due to the applied method.
The frequency-dependent ultrasonic attenuation is modeled using the following power-law:
𝛼(𝑓)=𝑎+𝑏𝑓𝑛
The attenuation coefficient 𝛼(𝑓) is composed of an absorption coefficient 𝑎, a scattering coefficient 𝑏, the frequency 𝑓 and the exponent 𝑛, where the absorption coefficient describes the internal friction losses and the scattering coefficient is the interesting grain size parameter (proportional to the mean grain size). The exponent 𝑛 results from the ratio of the acoustic wavelength to the mean grain size, where three types of scattering can be distinguished, Rayleigh (𝑛=4), Stochastic (𝑛=2), and Geometric Scattering[1].
𝛼(𝑓)=𝑎+𝐶 (𝐷−𝐷0)𝑛−1 𝑓𝑛
The scattering coefficient 𝑏 is the product of the material-dependent parameter 𝐶 and the relative change in the mean grain size 𝐷−𝐷0 (𝐷0 – grain size of the initial state). A calibration of the model using mean grain size values from micrographs at certain temperature conditions provides the parameter 𝐶 [2].
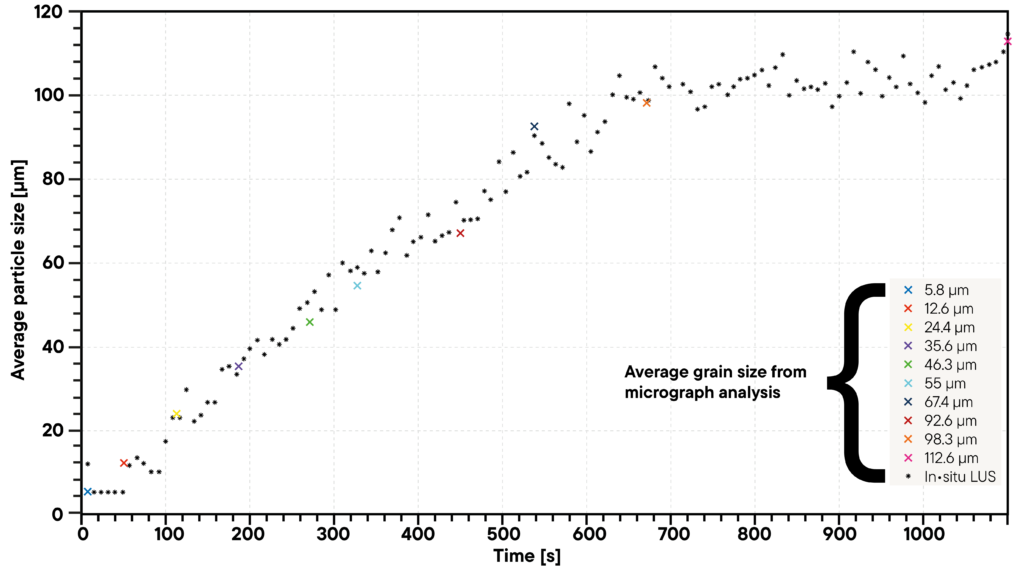
Laser ultrasound measurements and data analysis using this attenuation model provide real-time insight (in-situ) into the grain growth of a material during thermal cycles. Figure 2 shows an impressive comparison of these LUS real-time results (points) with several time-consuming micrograph analyzes (colored X markings).
Citations:
[1] S. Sarkar, A. Moreau, M. Militzer, and W. J. Poole, “Evolution of austenite recrystallization and grain growth using laser ultrasonics,” Metall. Mater. Trans. A Phys. Metall. Mater. Sci., vol. 39 A, no. 4, pp. 897–907, 2008, doi: 10.1007/s11661-007-9461-6.
[2] T. Garcin, J. H. Schmitt, and M. Militzer, “In-situ laser ultrasonic grain size measurement in superalloy INCONEL 718,” J. Alloys Compd., vol. 670, pp. 329–336, 2016, doi: 10.1016/j.jallcom.2016.01.222.


